데이터 프레임이나 데이터를 사람 눈에 한눈에 들어오게 하려면 차트를 그려서 보여주는것이 효과적이다.
오늘은 Matplotlib을 이용한 차트 그리기를 해보겠다.
1. Bar Charts 카테고리컬 데이터를 활용한 countplot
바 차트로 카테고리컬 데이터를 표현해보자
#기본적으로 import해야될 라이브러리
import numpy as np
import pandas as pd
import matplotlib.pyplot as plt
import seaborn as sb

%matplotlib inline

#데이터 프레임 불러오기(파일에 있는 데이터)
df = pd.read_csv('../data/pokemon.csv')
df
데이터 프레임을 보게되면 generation_id가 카테고리컬 데이터라는 것을 알 수 있다.
이제 차트를 그려보자
#특정 컬럼이 카테고리컬 데이터일때,
#각 value 별로 몇개씩 있는지를 차트로 나타내고 싶을때
#seaborn 의 countplot 함수 사용

#컬러를 선택하는 함수
base_color=sb.color_palette()[2]

#기본 데이터는 df, x축은 generation_id, 컬러는 녹색,
sb.countplot(data= df, x='generation_id',color=base_color)
plt.show()
차트는 나왔지만 정렬이 되지 않았다. 정렬을 하기 위해서는 order라는 파라미터를 알아야한다.
#오더를 줘서 인덱스를 다르게 줄수 있다.
base_order = df['generation_id'].value_counts().index
sb.countplot(data= df, x='generation_id',color=base_color, order=base_order)
plt.show()
만약 차트를 가로로 돌리고 싶다면 x데이터를 y데이터로 써주면 된다.
# 차트의 y축으로 돌리는 방법
sb.countplot(data= df, y='type_1',color=base_color,order=base_order)

plt.show()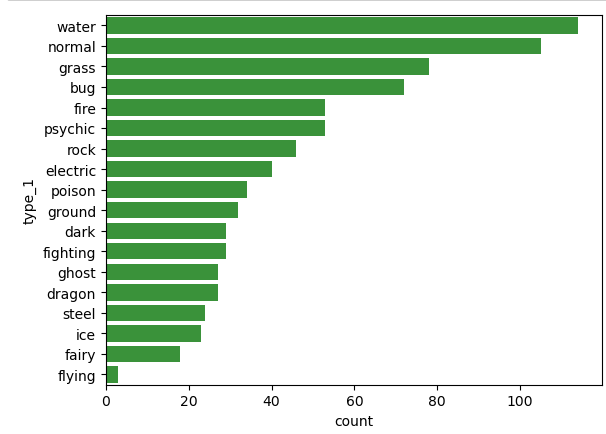
2) 파이차트
파이차트는 퍼센테이지로 비교해서 데이터를 보고 싶을때 사용된다. 파이차트를 그려보자
#df 로는 파이차트를 바로 그릴수가 없다.
#따러서, 제너레이션 아이디별로 데이터가 몇개인지 우리가 먼저 구해놓는다.
df2 = df['generation_id'].value_counts()

# generation_id 별로 데이터의 개수를
#퍼센테이지로 비교할수 있도록,파이차트로 나타낸다.

plt.pie(df2, labels=df2.index, autopct='%.1f',startangle= 90 ,
       wedgeprops= {'width':0.7})

#한글은 별도의 라이브러리가 필요하다(그냥쓰면 깨진다.)
plt.title('Generation id Pie Chart')

plt.show()
범례(legend)를 추가할수 있다.
plt.pie(df2, labels=df2.index, autopct='%.1f',startangle= 90 ,
       wedgeprops= {'width':0.7})

#한글은 깨짐
plt.title('Generation id Pie Chart')

plt.legend(['id5' , 'id1', 'id3','id4','id2','id6','id7'])

plt.show()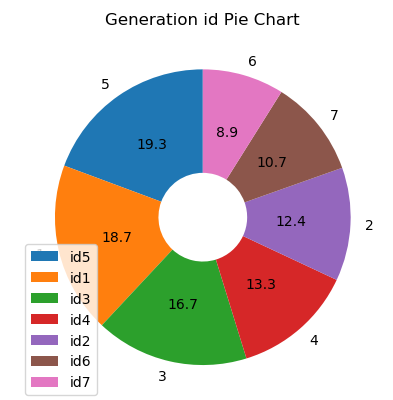
3. 히스토그램
히스토그램은 구간을 설정하여, 해당 구군에 포함되는 데이터가 몇개인지 세는 차트를 히스토그램이라고 한다. 히스토그램의 가장 큰 특징은 bin(구간)을 자유롭게 설정이 가능하다는 점이다.
plt.hist(data = df, x='speed')
plt.show()
여기서는 구간이 너무 붙어있다. 구간을 제대로 설정하지 않으면 그래프 정보가 잘못 전달 될 수 있다.
#bins 의 갯수는 기본이 10개
#구간사이의 간격을 0.8로 맞춘다.
plt.hist(data = df, x='speed',rwidth=0.8)
plt.show()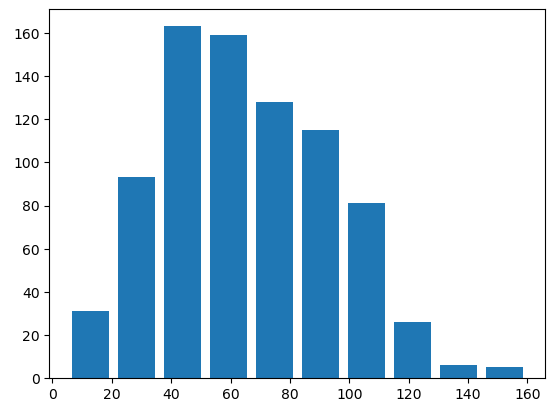
이제 구간을 다시 설정하여 정확한 값을 알아보자
#bins의 갯수를 변경하는법
plt.hist(data = df, x='speed',rwidth=0.8,bins=10)
plt.show()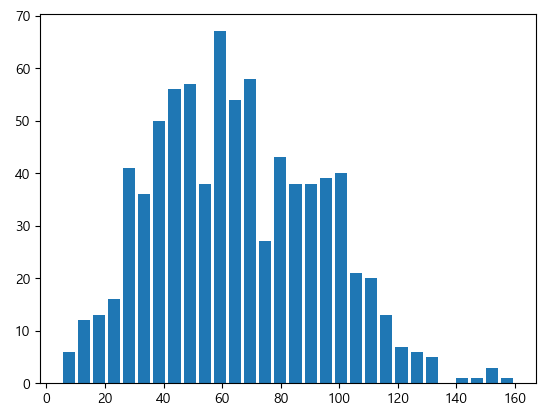
bins의 값을 원하는 범위로 지정할 수 있다.
#5부터 160까지 7개씩 설정
my_bins=np.arange(5,160+7,7)

#bins의 갯수를 변경하는법
plt.hist(data = df, x='speed',rwidth=0.8,bins =30)
plt.show()
하나의 출력화면에 다수의 차트를 출력할수 있다.
# 하나에 여러개의 plot을 그린다.

#비율을 조절하는 함수
plt.figure(figsize=(12,5))


plt.subplot(1,2,1)

plt.title('speed hist , bins10')
plt.xlabel('speed')
plt.ylabel('# of characters')

plt.hist(data = df, x='speed',rwidth=0.8)

plt.subplot(1,2,2)

plt.title('speed hist , bins30')
plt.xlabel('speed')
plt.ylabel('# of characters')

plt.hist(data = df, x='speed',rwidth=0.8,bins=30)

plt.show()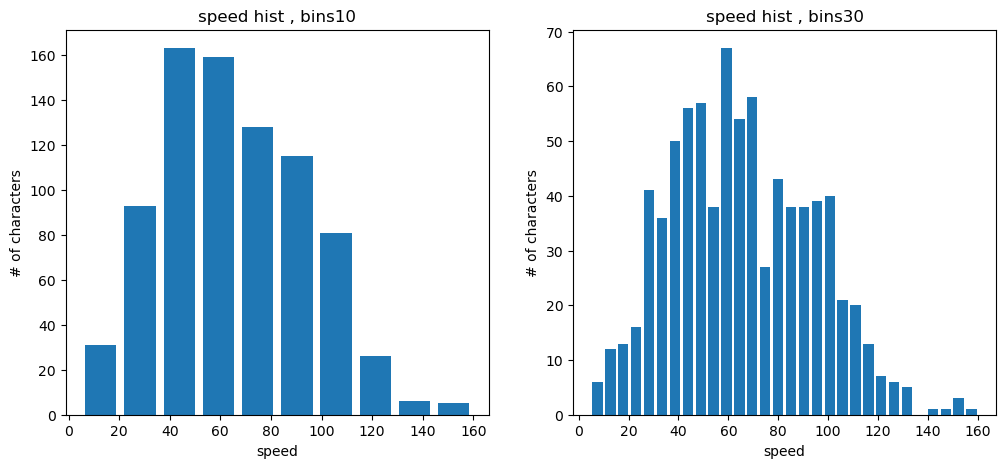
반응형
'파이썬 함수' 카테고리의 다른 글
| 파이썬 프로젝트(1) 인구조사 차트 그려보기 (0) | 2022.11.29 |
|---|---|
| 파이썬 함수Matplotlib을 이용한 차트 그리기(2) Scatter plots와 히트맵 (0) | 2022.11.28 |
| pandas 라이브러리(8) 데이터 합치기 (0) | 2022.11.25 |
| pandas 라이브러리(7) 데이터 정렬 SORTING AND ORDERING (0) | 2022.11.25 |
| pandas 라이브러리(6) 함수 적용 APPLYING FUNCTIONS (0) | 2022.11.25 |